news23.06.2022
| 23.06.2022
#ShowYourStripes
We at CES are acting because without us as the private sector committing to become part of the solution rather than to be the problem, there will be not much hope to limit global warming.
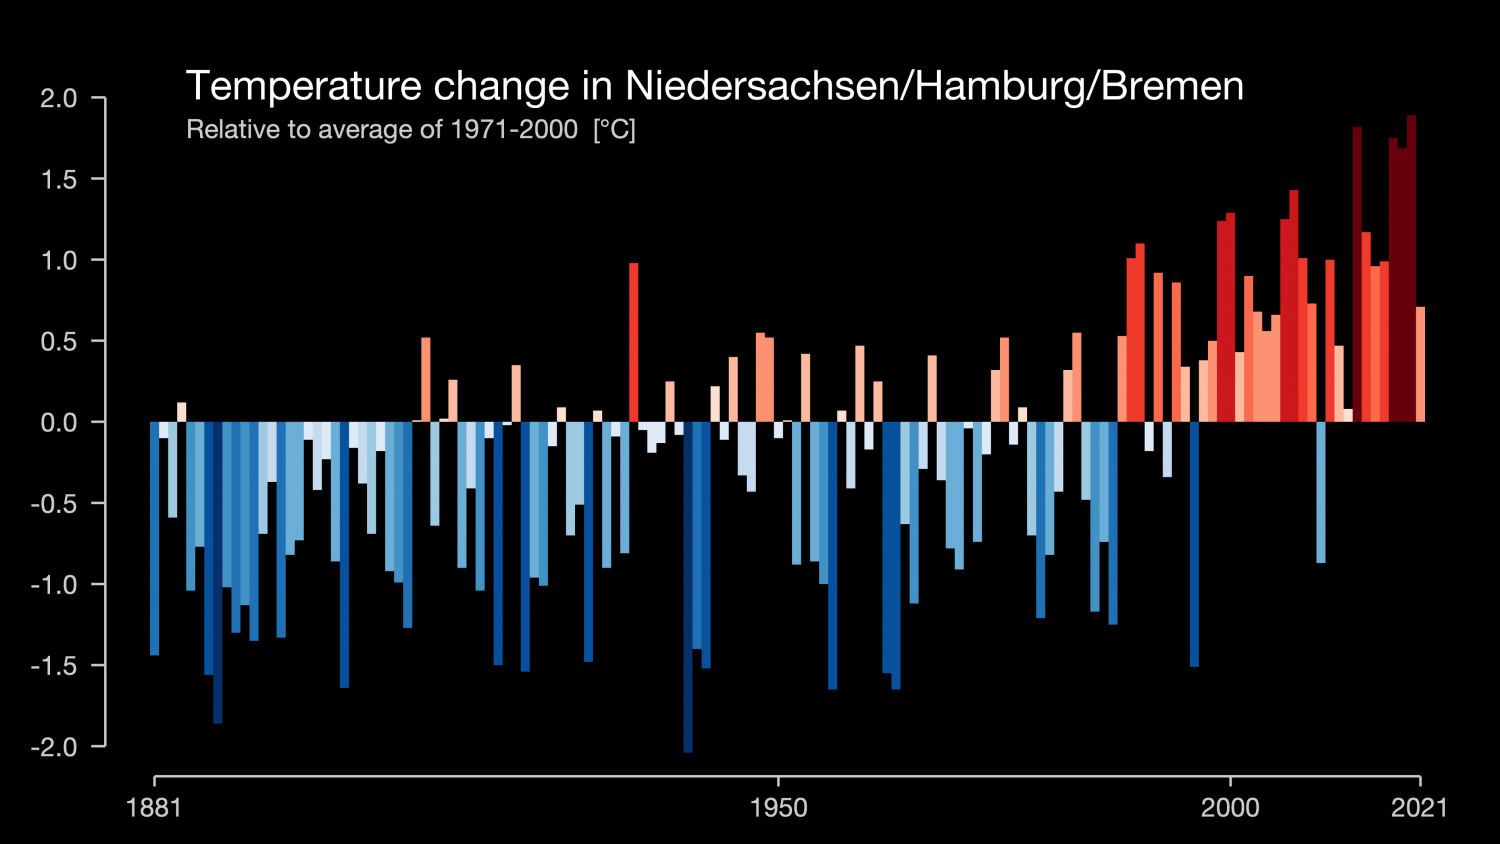
The warming stripes are a visual representation of how temperature has changed in locations around the world. They were created by Ed Hawkins, a climate scientist from the University of Reading in the UK. He also created the „warming spiral“ graphic that was used during the closing ceremonies of the Rio Olympics. Each stripe represents a year. Blue means it’s colder than average. White means it’s about average. Pink means it’s warmer. And red means it’s a LOT warmer!